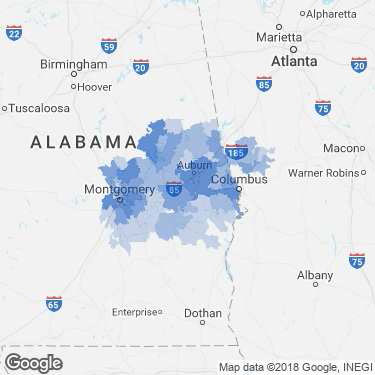
An Overview Of Our 60 Minute Drivetime Labor Shed
Population grew by 11,910 over the last 5 years and is projected to grow by 9,278 over the next 5 years.
grew by 16,616 over the last 5 years and are projected to grow by 12,402 over the next 5 years.
Regional average earnings per job are $14.2K below the national average earnings of $63.6K per job.
As of 2017, the region’s population increased by 1.8% since 2012, growing by 11,910. Population is expected to increase by 1.4% between 2017 and 2022, adding 9,278.
From 2012 to 2017, jobs increased by 6.1% in 9 counties, from 273,151 to 289,766. This change fell short of the national growth rate of 7.6% by 1.5%. As the number of jobs increased, the labor force participation rate decreased from 56.8% to 55.9% between 2012 and 2017.
Concerning educational attainment, 15.8% of Macon County’s residents possess a Bachelor’s Degree (2.6% below the national average), and 7.4% hold an Associate’s Degree (0.5% below the national average).
2017 Labor Force Breakdown
|
|
Population
|
|---|---|
|
Total Working Age Population
|
542,552
|
|
Not in Labor Force (15+)
|
239,181
|
|
Labor Force
|
303,371
|
|
Employed
|
292,882
|
|
Unemployed
|
10,489
|
|
Under 15
|
123,388
|
Educational Attainment
15.8% of Macon County’s residents possess a Bachelor’s Degree (2.6% below the national average), and 7.4% hold an Associate’s Degree (0.5% below the national average).
|
|
Population
|
|---|---|
|
Total Working Age Population
|
542,552
|
|
Not in Labor Force (15+)
|
239,181
|
|
Labor Force
|
303,371
|
|
Employed
|
292,882
|
|
Unemployed
|
10,489
|
|
Under 15
|
123,388
|
Population Characteristics
Macon County has 149,628 millennials (ages 20-34). The national average for an area this size is 137,561.
Retirement risk is about average in Macon County. The national average for an area this size is 101,018 people 65 or older, while there are 95,042 here.
Macon County has 48,861 veterans. The national average for an area this size is 38,812.
Educational Pipeline
In 2016, there were 12,324 graduates in 9 counties. This pipeline has grown by 7% over the last 5 years. The highest share of these graduates come from Business Administration and Management; General; Psychology, General; and Registered Nursing/Registered Nurse.